Elastic Search (ELK)
Published
Estimated reading time: 3 min
Introduction
Elastic Search is used when you want quickly search through lots of data in near real time. You can find it on https://www.elastic.co/. It provides distributed system for quering and filtering stored data through API and is compatible with JSON out of the box. I used Apache Solr in the past when I was working on projects that needed full text search capabilities. But because because Elastic Search is able not to just search text but easily query, filter and group data I quickly switched. It also much easily able to scale and expand the cluster (automatic shard-rebalancing).
Elastic Search is designed to run in cluster which consists from Nodes and has clross-cluster replication feature which is used when main cluster is down and you need a hot backup. A database in RDBMS view is called Index which in short means a collection of documents with similar characteristics. The Document is like row in RDBMS, and is basically a JSON file.
Shards
When you create an index, you can simply define the number of shards you want. Each shard is fully-functional “index” that can be hosted on different nodes in the cluster which allows to horizontally split data volume and make parallelization/high availability to happen.
ELK
Search engine is just a core, what you also commonly get is the full stack - Logstash and Kibana and these combination is called ELK.
Kibana
From visualization point of view - it is similiar to Grafana which I quite heavily use almost on every project.
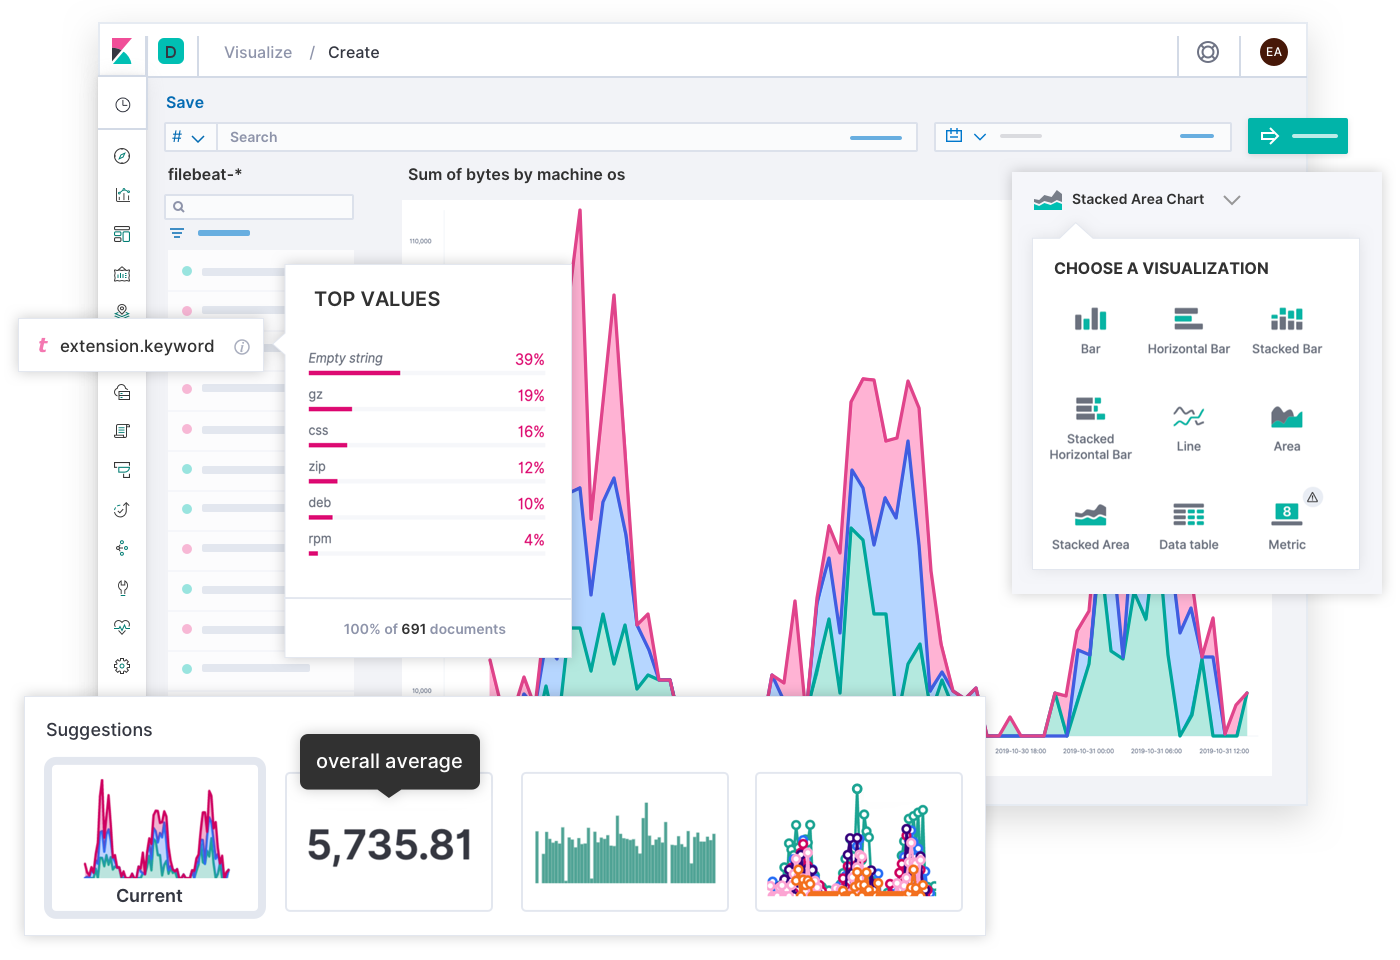
It lets you visualize Elasticsearch data - there are number of classic charts (histograms, line and pie charts etc.) and it also contains Geo data vizualization. You can also chart data with relationships (drill-downs). Please find more details on https://www.elastic.co/kibana.

Logstash
Server-side data processing pipeline which is able to ingest data from multiple data sources, transform it and then send it to Elastic Search to store it - and query it. There are bundle of filters available making a job easy for you - like for example anonymization of data.
Please find more details on https://www.elastic.co/logstash
Summary
In a way, Logstash is similar to Prometheus when you want to store metrics and monitor the application. But when you need something more than just a metrics - like searching, it is better to start using ELK. And once you do, it makes sense to use it also for metrics gathering. The benefit of Prometheus-Kibana solution is low HW requirements in comparison to ELK.
Usecases
- Fast Searchable datastore
- Vizualization for existing databases or services buses (Apache Kafka)
- Subscriptions to event - alerting and conditional watch capabilities
- Metrics, monitoring and analytics capabilities (keep in mind a bit lightweight Prometheus)