Grafana
Published
Estimated reading time: 1 min
Introduction
I use Grafana whenever I want to visualize some backend stats. You can find it on https://grafana.com/ , it is open-source and you can easily install it on your infrastructure.
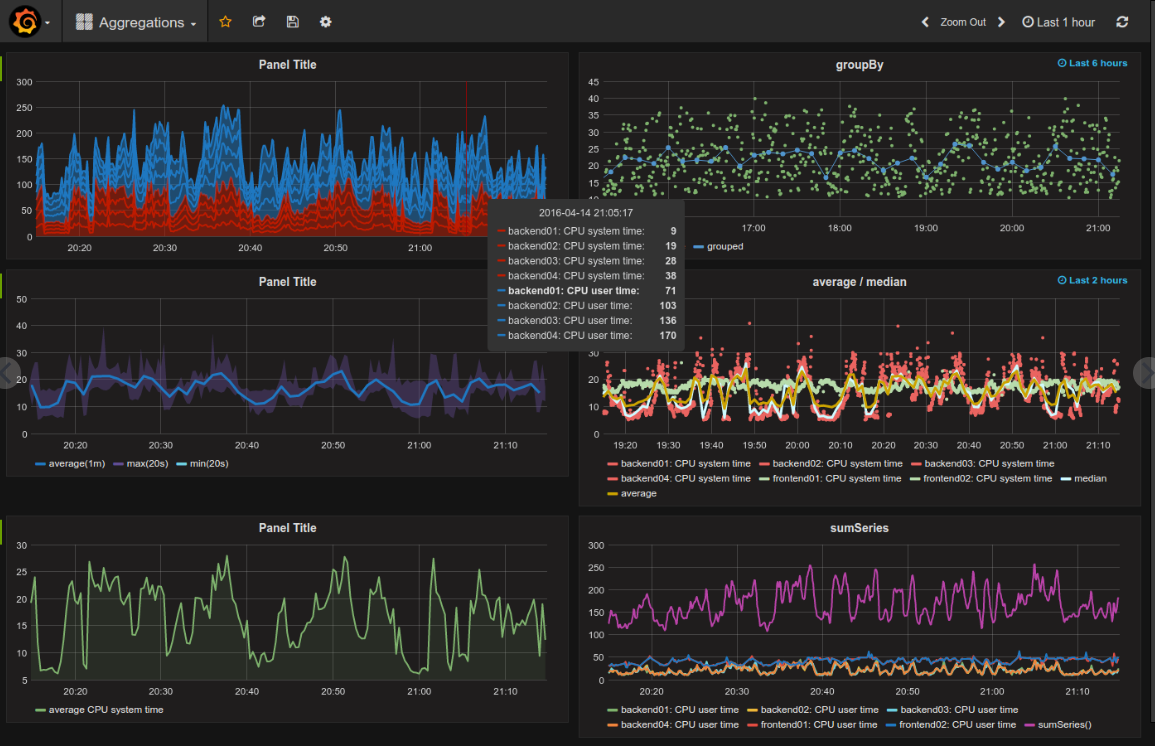
It provides number of different panels with which you are able to see your data or statistics. I use it with connection to Prometheus.
Here you can see the HW statistics from servers:

You can also easily add alerts and have notifications if some treshold is violated to you email or even telegram app.
I use it regularly with connection to Prometheus to see stats what is happening inside of the backend or the frontend.
Maps
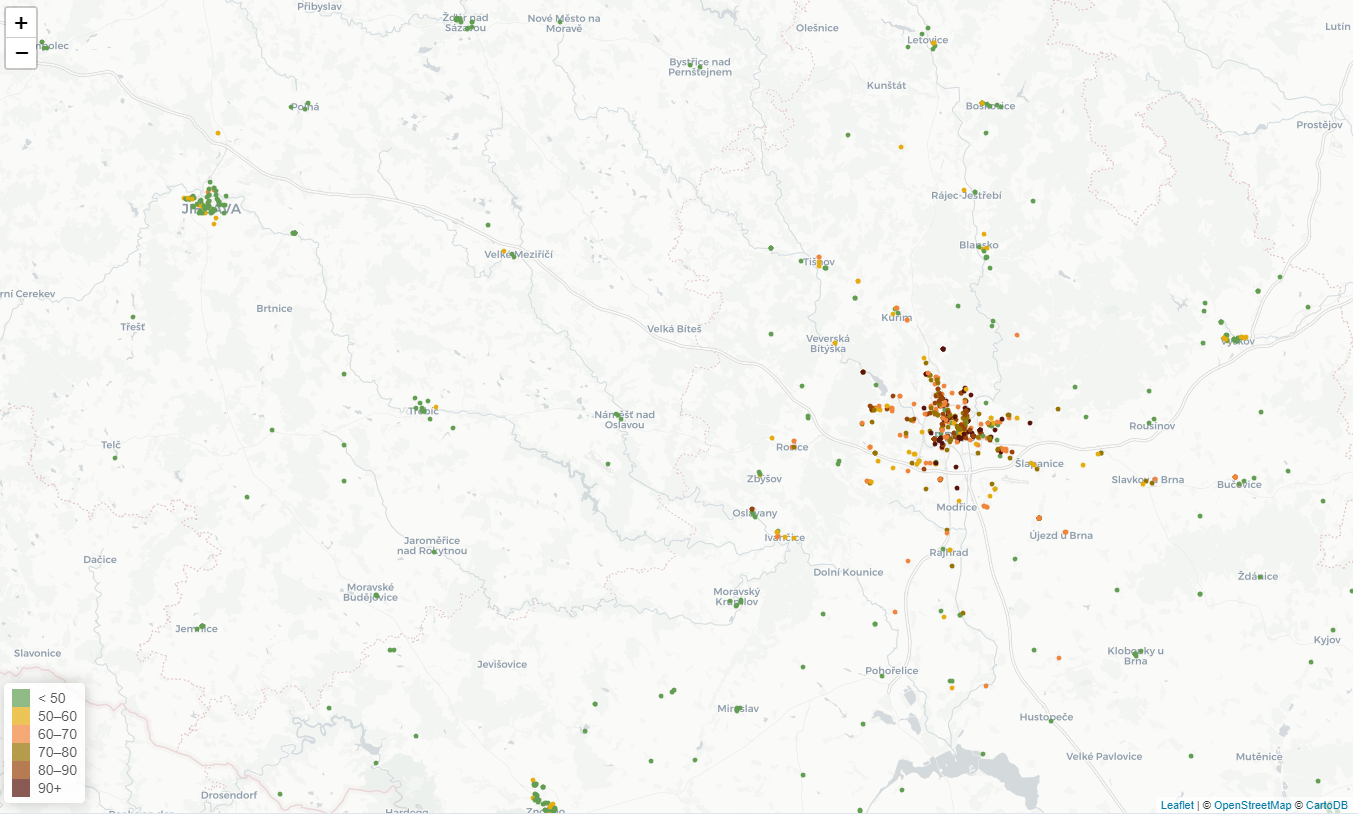
The other nice feature I like is to use it with connection to maps like here:

Tabular data
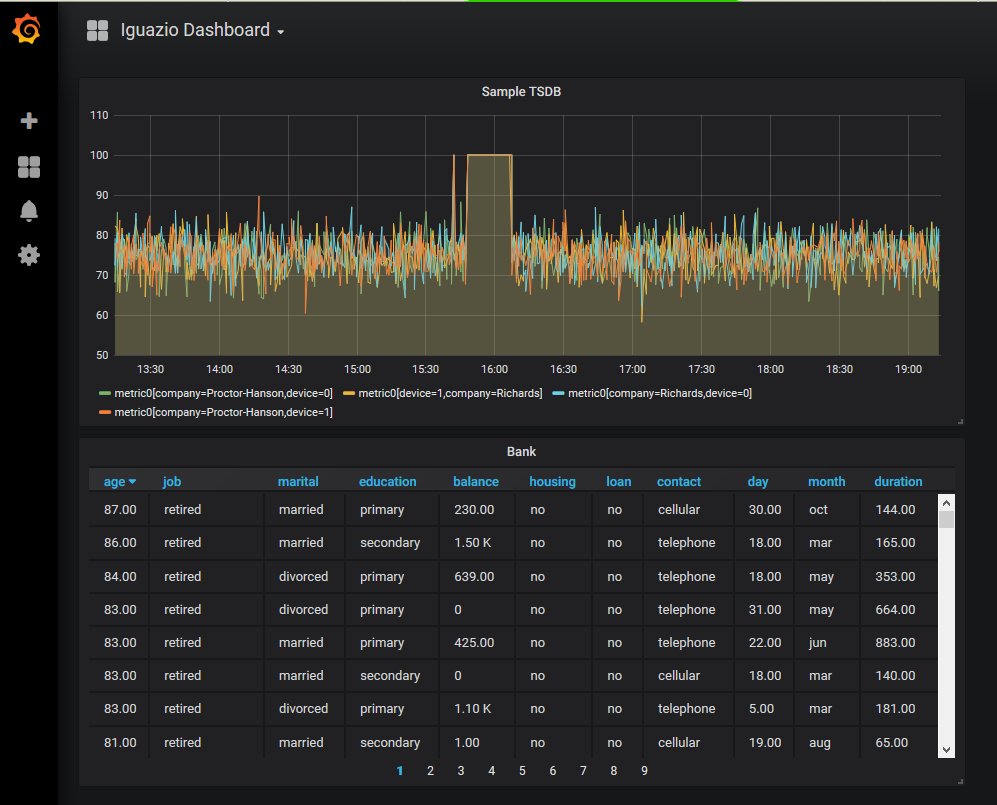
Least but not last, it is also able to display tabular data with conditional formatting too.
